Spanberger Leads Earle-Sears by 10 Points in the Race for Governor
Hashmi Leads Reid by 9 points in Lt. Governor Contest; Jones Leads Miyares by 6 Points in Attorney General Race
Summary of Key Findings
- Democrat Abigail Spanberger leads Republican Winsome Earle-Sears by 10 points, 52% to 42% among Virginia likely voters; 6% remain undecided or don’t know.
- In the Lieutenant Governor race, Democrat Ghazala Hashmi leads Republican John Reid by 9 points among Virginia likely voters, 48% to 39%; 12% say they are undecided or don’t know.
- In the race for Attorney General, Democrat Jay Jones leads Incumbent Republican Jason Miyares by 6 points among Virginia likely voters, 49% to 43%; 9% say they are undecided or don’t know.
- Top of mind issues for Virginia likely voters include threats to democracy (19%), inflation (18%), immigration (10%), and healthcare (10%).
- Virginia likely voters say Spanberger would do a better job than Earle-Sears handling climate change (+26), reproductive rights (+20), health care (+18), transgender policy (+13), K-12 education (+12), threats to democracy (+10), inflation (+9), federal workforce reductions (+8), and gun policy (+7), immigration (+6), taxes (+4) and crime (+2).
- 50% of Virginia likely voters approve of Governor Youngkin’s job performance while 42% disapprove; 8% say they don’t know. President Trump’s approval remains underwater with 41% of Virginia likely voters saying they approve of President Trump’s job performance while 56% disapprove; 3% say they don’t know.
Summary and Background: Early voting is well underway in the Commonwealth of Virginia and Election Day is just over 4 weeks out, Tuesday November 4th. We surveyed Virginia likely voters on their vote choice for governor, lieutenant governor, attorney general, and a generic ballot for the VA House of Delegates. We also asked about top-of-mind policy issues and which gubernatorial candidate voters believe will handle a range of policy issues best.
14% of the Virginia likely voters we surveyed indicate they have already voted in the Virginia elections and there is some variation by partisanship; 19% of Democrats say they have already voted compared to 13% of Independents and 8% of Republicans. While Democrats have traditionally used early/mail in voting more frequently than Republicans, the Republican Party has promoted early voting more heavily in recent elections, which is likely reflected in these results. Overall, the statewide races have slightly tightened since our last survey, released September 18th, though differences generally remain within the margin of error (+/-3.9%). The Wason Center will survey these races one more time before Election Day to capture any final shifts in expected voting behavior and issue importance.
Enthusiasm: Virginia likely voters remain enthusiastic to vote in the upcoming elections, staying nearly steady from our last poll. 86% indicate they are either very enthusiastic (55%) or somewhat enthusiastic (31%). Enthusiasm between Republicans and Democrats has tightened since our last survey with 61% of Democrats indicating they are very enthusiastic compared to 59% of Republicans and 48% of Independents; September 18th numbers were 69% (D), 56% (R) and 42% (I) respectively.
Favorability ratings for candidates running for Governor, Lieutenant Governor, and Attorney General: We ask Virginia likely voters whether they have a favorable or unfavorable opinion of the respective candidates running for statewide office in Virginia.
Looking to the candidates for Virginia governor, overall, Democratic candidate and former Congresswoman Abigail Spanberger has a +5 favorability rating (43% favorable to 38% unfavorable) with 18% indicating they have no opinion/don’t know. Current Lieutenant Governor and Republican Winsome Earle-Sears has a -1 favorability rating (38% favorable to 39% unfavorable); 23% say no opinion/don’t know.
Candidates for Lieutenant Governor are still not particularly well-known among Virginia likely voters, though awareness has increased slightly from our previous poll. Republican candidate John Reid has a -1 favorability rating (15% favorable to 16% unfavorable), though a large percentage (69%) say they do not know enough about him to have an opinion. State Sen. Ghazala Hashmi has a +3 favorability rating (19% favorable to 16% unfavorable); 65% say no opinion/don’t know.
Incumbent Attorney General Jason Miyares has a +7 favorability rating (31% favorable to 24% unfavorable) with 46% saying no opinion/don’t know. Democratic candidate Jay Jones has a +2 favorability rating (28% favorable to 26% unfavorable); 45% indicate no opinion/don’t know.
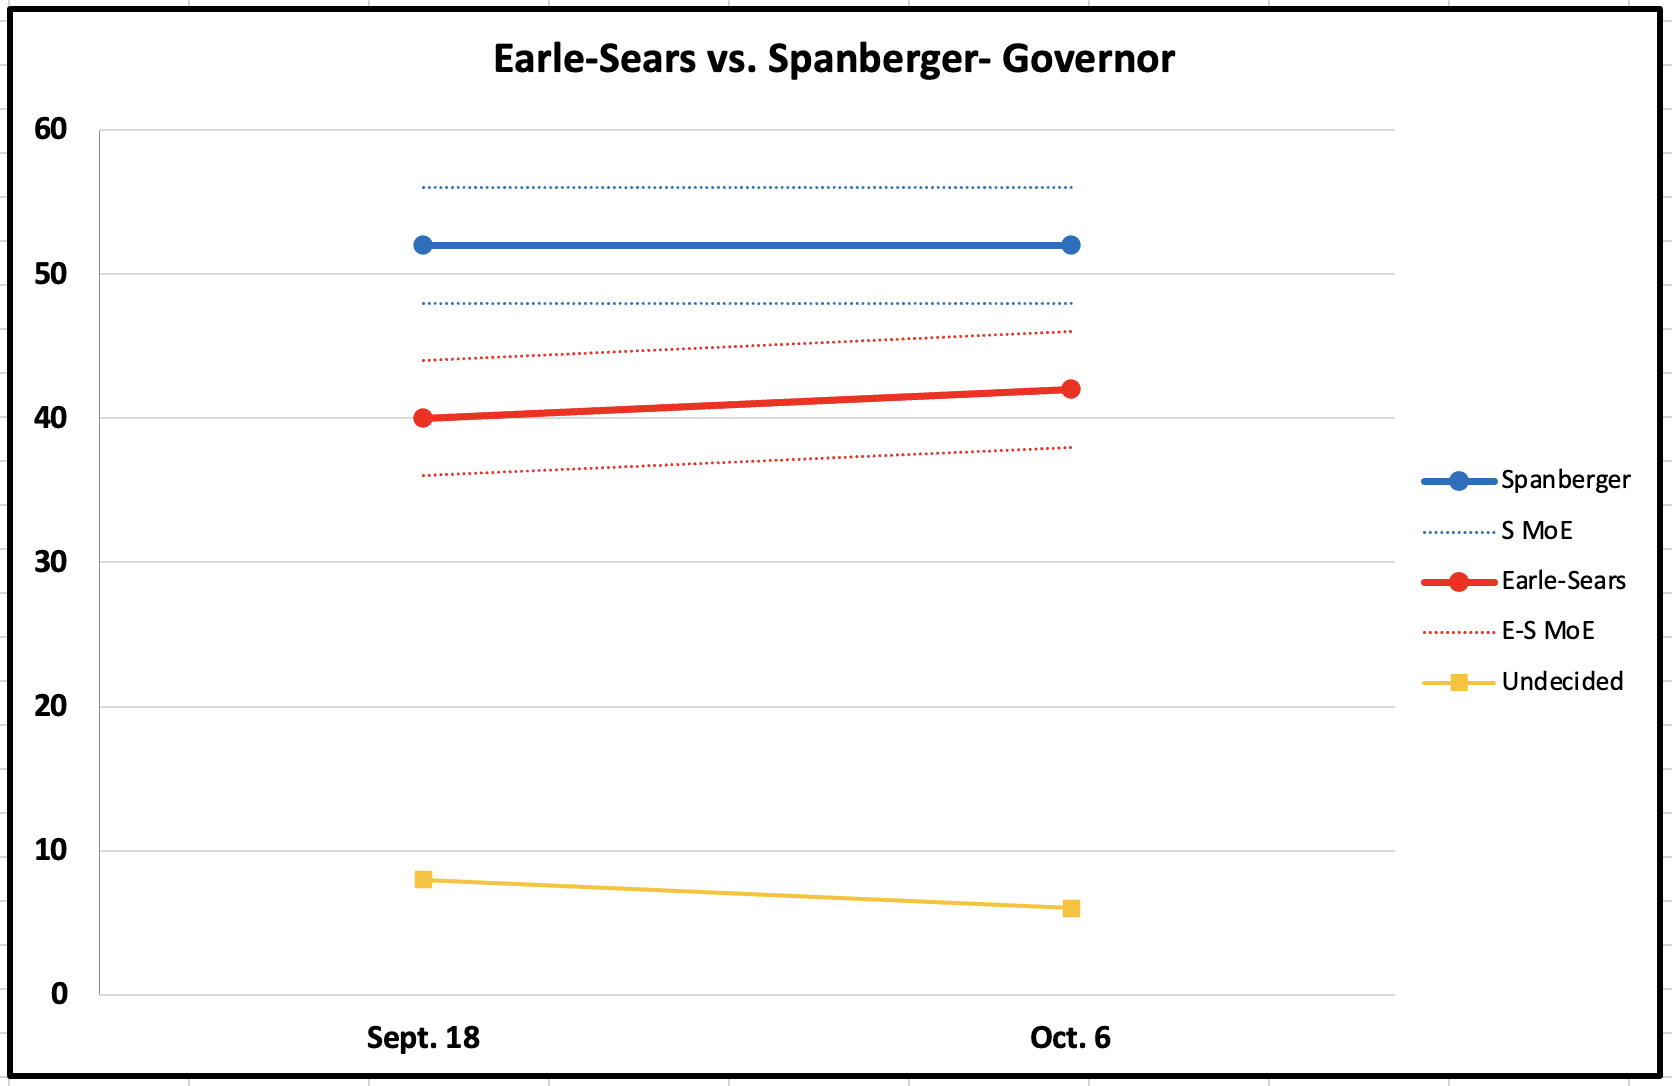
Gubernatorial Vote Choice:Among Virginia likely voters Spanberger leads Earle-Sears by 10 points, 52% to 42%, with 6% saying they are undecided/don’t know.
Spanberger’s support is currently driven by Democratic voters (98%), Independents (49% to 37%), Black voters (80% to 12%), women (60% to 34%), voters aged 18-44 (50% to 41%), and voters with college degrees (61% to 33%).
Earle-Sears’ support within her own party sits at 95% and she holds a lead among white voters (52% to 43%), male voters (51% to 42%), and voters without college degrees (50% to 44%).
Lieutenant Governor Vote Choice: Virginia State Sen. Ghazala Hashmi holds a 9-point lead among Virginia likely voters against Republican John Reid (48% to 39%); 12% remain undecided/don’t know, while 1% say they will vote for someone else.
Hashmi has an advantage among Independents (+12), women (+25), Black voters (+60), and voters with a college degree (+27). Reid’s support comes primarily from fellow Republicans at 91%, white voters (+8), male voters (+11), and voters without college degrees (+9).
Attorney General Vote Choice: Democrat Jay Jones holds a 6 point lead over Incumbent Attorney General Jason Miyares among Virginia likely voters (49% to 43%); 9% remain undecided/don’t know.
Jones’ lead is bolstered by support from Democrats (96%), Independents (45% to 40%), women voters (58% to 34%), Black voters (77% to 13%), younger voters (47% to 44%), and voters with college degrees (58% to 33%). Miyares has support among Republicans (94%), Male voters (52% to 39%), white voters (52% to 41%), and voters without college degrees (52% to 41%).
Generic Ballot Vote Choice, House of Delegates: We asked Virginia likely voters which party’s candidate they are more likely to vote for in their House of Delegates district. The Democratic Party has a 7-point advantage over the Republican Party (51% to 44%) on this generic ballot question.
Key issues: Virginia likely voters are asked which issue is top of mind when they think about voting in the upcoming elections. 19% say threats to democracy, followed by 18% who say inflation/cost of living and an even split between healthcare (10%) and immigration (10%).
There have been some shifts on top issues since our last survey with threats to democracy very narrowly overtaking inflation as the top issue and healthcare overtaking K-12 education and crime.
Top of mind issues vary by party with Republicans fairly split between inflation/cost of living (21%), immigration (21%) and crime (15%). Top issues among Democrats include threats to democracy (36%), healthcare (16%), and inflation/cost of living (15%). Most Independents say threats to democracy (20%), followed by inflation/cost of living (19%), and healthcare (11%).
Handling of key issues: We also ask Virginia likely voters whether they think gubernatorial candidates Winsome Earle-Sears or Abigail Spanberger would do a better job handling a series of policy issues. Spanberger comes out ahead of Earle-Sears on all 12 policy issues, albeit very narrowly on some. More specifically, Virginia likely voters say Spanberger would do a better job than Earle-Sears handling climate change (+26), reproductive rights (+20), health care (+18), transgender policy (+13), K-12 education (+12), threats to democracy (+10), inflation (+9), federal workforce reductions (+8), and gun policy (+7), immigration (+6), taxes (+4) and crime (+2).
Gubernatorial and Presidential Approval:Governor Youngkin’s job approval among Virginia likely voters is a net +8 with 50% saying they approve of his job performance while 42% disapprove; 8% say they don’t know. Gubernatorial approval falls largely along partisan lines, with 94% of Republicans saying they approve of Governor Youngkin’s job performance, while 81% of Democrats disapprove; 50% of Independents say they approve relative to 38% who disapprove.
President Trump’s approval rating remains underwater (-15) with 41% saying they approve of the way he is handling his job as president compared to 56% who disapprove; 3% say they don’t know.
This figure tracks any changes in vote choice from our first survey on September 18 through this second survey, with margin of error bands placed around each candidate’s share of the vote.
How the survey was conducted:
The results of this survey are based on 805 interviews of registered Virginia voters who are likely general election voters, including 165 on landline and 640 on cell phone, conducted Sept. 29 to Oct. 1, 2025. A likely general election voter is one who has voted in at least two of the last four general elections and indicates they plan to vote in the upcoming elections. The margin of error for the whole survey is +/-3.9% at the 95% level of confidence. This means that if 50% of respondents indicate a topline view on an issue, we can be 95% confident that the population’s view on that issue is somewhere between 46.1% and 53.9%. The margin of error for subgroups may be higher. All error margins have been adjusted to account for the survey’s design effect, which is 1.3 in this survey. The design effect is a factor representing the survey’s deviation from a simple random sample and takes into account decreases in precision due to sample design and weighting procedures. In addition to sampling error, the other potential sources of error include non-response, question wording, and interviewer error. Percentages may not equal 100 due to rounding. Five callbacks were employed in the fielding process. Live calling was conducted by Dynata interviewers. The data reported here are weighted using an iterative (raked) weighting process on region, age, race, sex, and education to reflect as closely as possible the expected makeup of the November 4, 2025 Virginia electorate. Parameters for the weights used in this survey come from the 2020 Census, the 2023 American Community Survey 1-Year Estimates, and the last two gubernatorial-year exit polls.
For further information contact:
Dr. Rebecca Bromley-Trujillo, Research Director
rebecca.bromleytrujillo@cnu.edu
Office: (757) 594-9140
Mobile: (269) 598-5008
Threads: @profbromley-trujillo
Cami Castleberry, Director
cami.castleberry@cnu.edu
Office: (757) 594-8033
Mobile: (757) 897-4966