Spanberger Leads Earle-Sears by 7 Points
Hashmi leads Reid by 2 points; after text messaging scandal, Miyares leads Jones by 1 Point in Attorney General Race
Summary of Key Findings
- Democrat Abigail Spanberger leads Republican Winsome Earle-Sears by 7 points, 50% to 43% among Virginia likely voters; 6% remain undecided or don’t know.
- In the Lieutenant Governor race, Democrat Ghazala Hashmi leads Republican John Reid by 2 points among Virginia likely voters, 47% to 45%; 7% say they are undecided or don’t know and 1% say they will vote for someone else.
- In the race for Attorney General, Incumbent Republican Jason Miyares now holds a 1-point lead over Democrat Jay Jones among Virginia likely voters, 46% to 45%; 8% say they are undecided or don’t know while 1% say they will vote for someone else.
- In the Generic Ballot test for House of Delegates, the Democratic Party’s candidate leads the Republican Party’s candidate by 8 points, 51% to 43%.
- Top of mind issues for Virginia likely voters include threats to democracy (18%), inflation (18%), healthcare (11%), and immigration (9%).
- 75% of Virginia likely voters have heard some (20%) or a lot (55%) about news reports regarding text messages sent by attorney general candidate Jay Jones in 2022. Among those that have heard at least a little about these text messages, 47% say that it is either very (32%) or somewhat likely (15%) to impact their vote choice for attorney general.
Summary and Background: In our final survey ahead of Election Day, Tuesday November 4th, we ask Virginia likely voters to share their vote intentions for statewide races for governor, lieutenant governor, attorney general, and a generic ballot for the VA House of Delegates. We also ask about top-of-mind policy issues and the recently reported text messaging scandal involving Democratic Attorney General candidate Jay Jones.
29% of the likely voters we surveyed indicate they have already voted in the Virginia elections with some variation by partisanship; 34% of Republicans say they have already voted compared to 23% of Independents and 30% of Democrats.
Enthusiasm: Likely voters remain enthusiastic to vote in the upcoming elections, staying nearly steady from our last poll. 85% indicate they are either very enthusiastic (56%) or somewhat enthusiastic (29%). Enthusiasm between Republicans and Democrats remains similar with 65% of Democrats indicating they are very enthusiastic compared to 60% of Republicans and 47% of Independents.
Gubernatorial Vote Choice: Among likely voters former U.S. Representative Abigail Spanberger leads Lieutenant Governor Winsome Earle-Sears by 7 points, 50% to 43%, with 6% saying they are undecided/don’t know and 1% saying they will vote for someone else. This represents a modest tightening in the race from our early October poll when Spanberger led by 10 points as seen in the figure below.
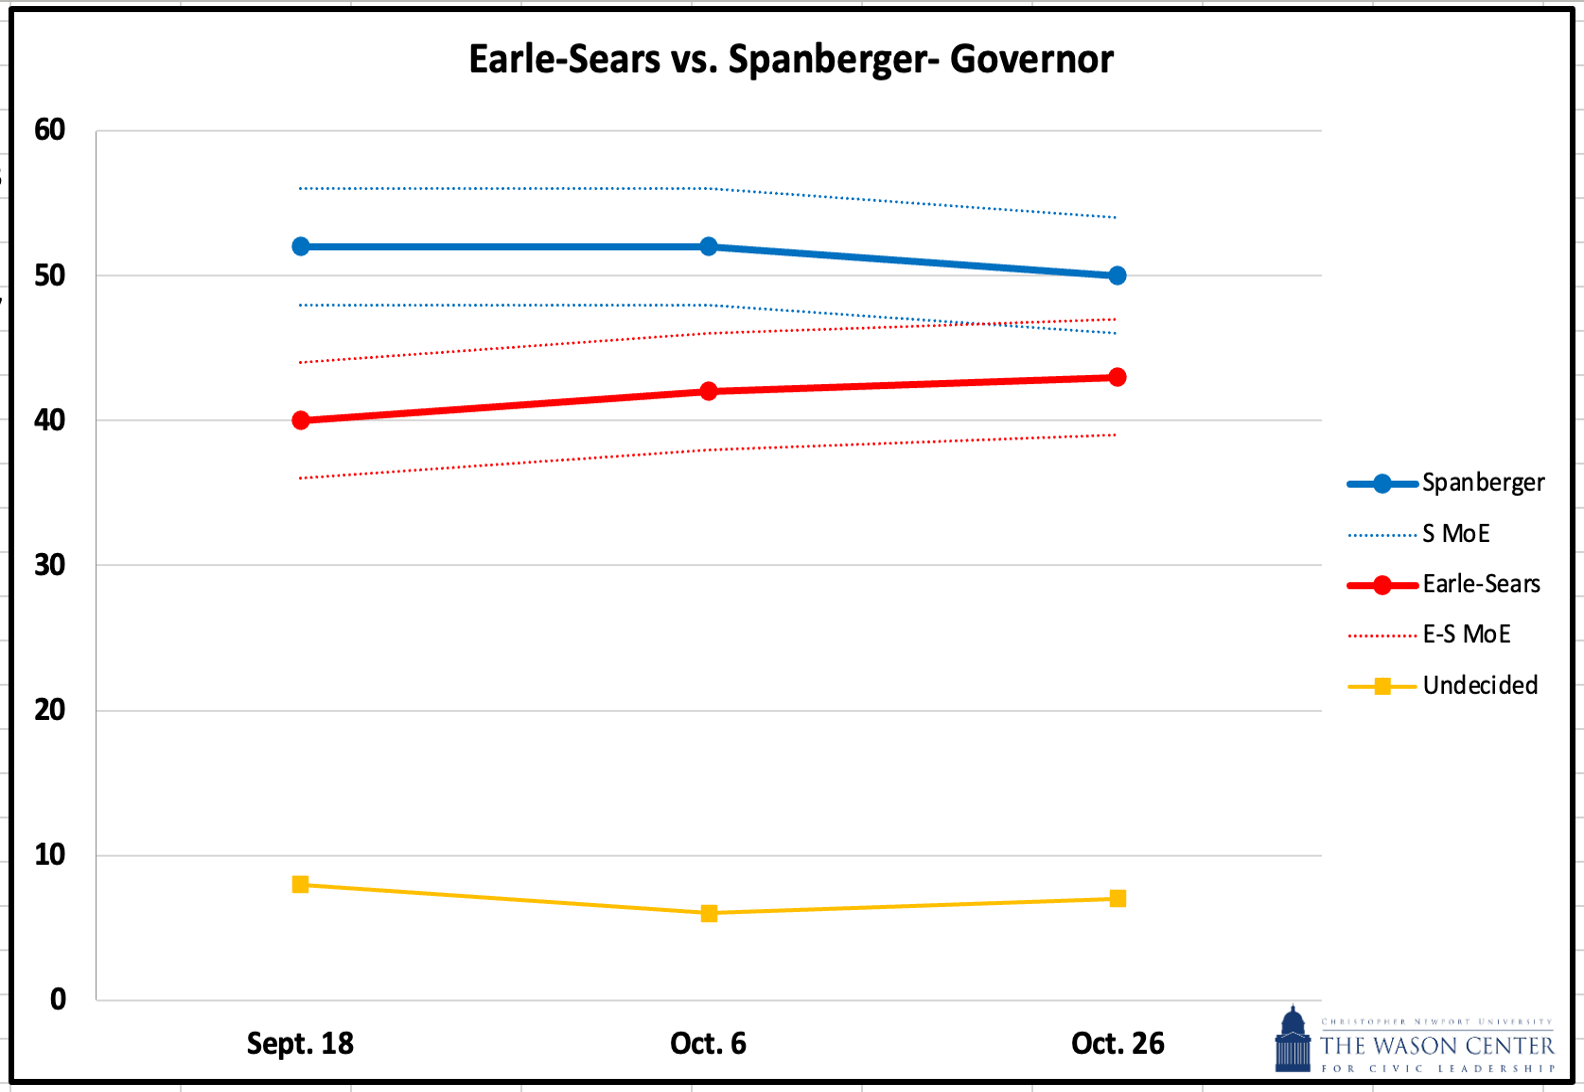
Spanberger’s support is currently driven by Democratic voters (97%), Independents (48% to 42%), Black voters (84% to 6%), women (57% to 37%), voters aged 18-44 (53% to 37%), and voters with college degrees (58% to 35%).
Earle-Sears continues to have support within her own party (95%) and she holds a lead among white voters (54% to 33%), male voters (51% to 43%), and voters without college degrees (52% to 43%).
Lieutenant Governor Vote Choice: Virginia State Senator Ghazala Hashmi has a narrow 2-point lead among likely voters against Republican John Reid (47% to 45%); 7% remain undecided/don’t know, while 1% say they will vote for someone else. In early October Hashmi was up 48% to 39%. The narrowing of this race shows Hashmi largely maintaining previous support while Reid has gained support among previously undecided voters. Hashmi and Reid are tied among Independents at 44% each; previously Hashmi held a 12-point advantage among Independents.
Hashmi does well among women voters (+13), Black voters (+71), and voters with a college degree (+19). She also has support from fellow Democrats at 94%. Reid’s support comes primarily from fellow Republicans at 97%, white voters (+15), male voters (+10), and voters without college degrees (+13).
Attorney General Vote Choice: A text-message scandal has shaken up the race for Attorney General and our survey shows a significant tightening of this race in the lead up to Election Day as shown in the figure below.
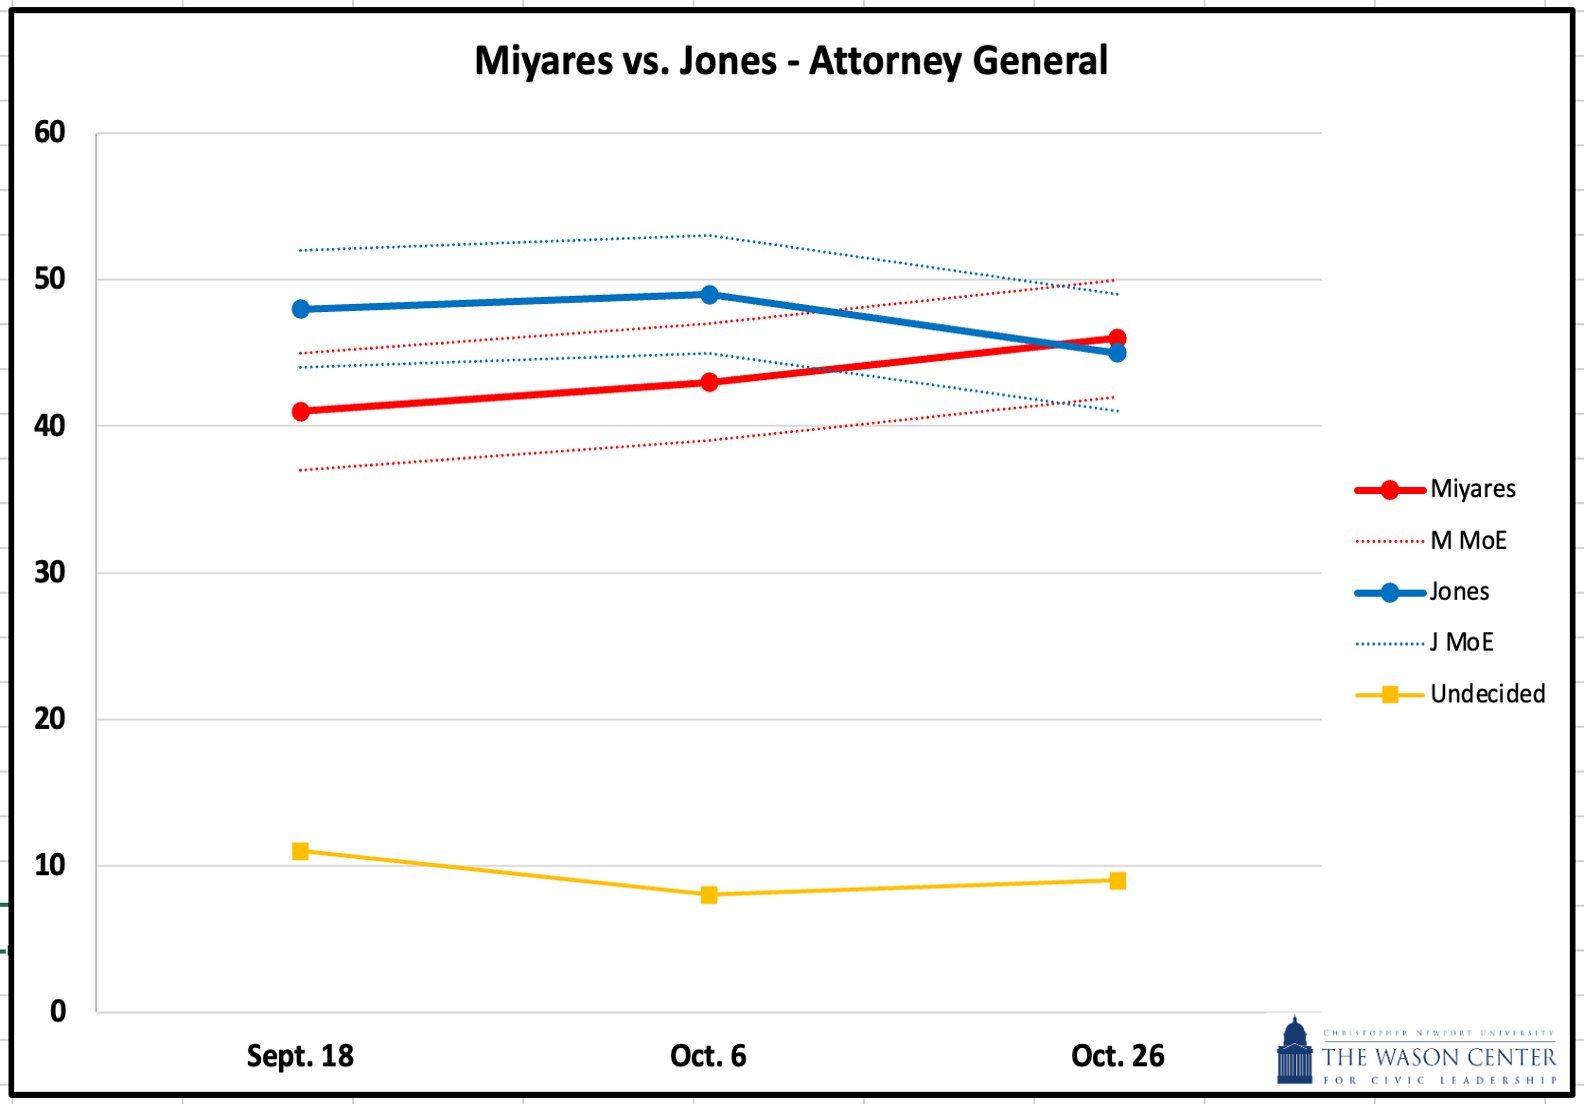
Republican Jason Miyares has a narrow 1-point lead among likely voters (46% to 45%); 8% remain undecided/don’t know and 1% say they will vote for someone else. Jones previously led by 6-points in our early October survey.
Miyares’ lead is driven by support among Republicans (97%), male voters (+19), Independents (+4), white voters (+19) and voters without college degrees (+10). Jones has support among Democrats (91%), though this number is down from 96% in our last survey. Jones has an advantage among women voters (+16), Black voters (+71), younger voters (+13), and voters with college degrees (+9). The shift in positions between the two candidates is driven by Independents, where Jones has lost significant ground having previously led this group by 5 points; he is now trailing Miyares among Independents by 4 points.
Generic Ballot Vote Choice, House of Delegates: We asked likely voters which party’s candidate they are more likely to vote for in their House of Delegates district. The Democratic Party candidate has an 8-point advantage over the Republican Party candidate (51% to 43%); 5% are undecided/don’t know. Democrats have maintained a 7-to-8 point lead on the generic ballot throughout the election season.
Key issues: Likely voters are asked which issue is top of mind when they think about voting in the upcoming elections. The top issues remain similar to our early October poll including threats to democracy (18%) and inflation/cost of living (18%), followed by healthcare (11%), and immigration (9%).
Top of mind issues vary by party with Republicans fairly split between immigration (20%) and cost of living/inflation (19%), followed by crime (12%). Top issues among Democrats include threats to democracy (31%), healthcare (19%), and inflation/cost of living (17%). Most Independents say threats to democracy (19%), followed by inflation/cost of living (17%), and K-12 education (10%).
Jones Text Scandal: Recent news reports of text messages sent by Jay Jones in 2022 have dramatically changed the context of the Virginia elections. We ask likely voters how much they have heard about these reports with 55% saying they have heard a lot, while 20% have heard some, 12% say they have heard a little, and 14% say they have heard nothing about these text messages.
Among those that have heard at least a little about the text messages, 47% say that it is either very (32%) or somewhat likely (15%) to impact their vote choice for attorney general, while 49% say it is either not very likely (12%) or not at all likely (37%) to impact their vote choice.
Among those that have heard at least a little about the text messages AND have said it is either very, somewhat or not very likely to change their vote choice, 3% say it will make them more likely to vote for Jones, while 56% have said it will make them less likely to vote for him, and 39% indicate it will have no change in whether they will vote for him. The shift is most pronounced among Independents, with 68% indicating it would make them less likely to vote for Jones compared to 60% for Republicans and 33% for Democrats.
How the survey was conducted:
The results of this survey are based on 803 interviews of registered Virginia voters who are likely general election voters, including 172 on landline and 631 on cell phone, conducted Oct. 21-23, 2025. A likely general election voter is one who has voted in at least two of the last four general elections and indicates they plan to vote in the upcoming elections. The margin of error for the whole survey is +/-4.1% at the 95% level of confidence. This means that if 50% of respondents indicate a topline view on an issue, we can be 95% confident that the population’s view on that issue is somewhere between 45.9% and 54.1%. The margin of error for subgroups may be higher. All error margins have been adjusted to account for the survey’s design effect, which is 1.4 in this survey. The design effect is a factor representing the survey’s deviation from a simple random sample and takes into account decreases in precision due to sample design and weighting procedures. In addition to sampling error, the other potential sources of error include non-response, question wording, and interviewer error. Percentages may not equal 100 due to rounding. Five callbacks were employed in the fielding process. Live calling was conducted by Dynata interviewers. The data reported here are weighted using an iterative (raked) weighting process on region, age, race, sex, and education to reflect as closely as possible the expected makeup of the November 4, 2025 Virginia electorate. Parameters for the weights used in this survey come from the 2020 Census, the 2023 American Community Survey 1-Year Estimates, and the last two gubernatorial-year exit polls.
For further information contact:
Dr. Rebecca Bromley-Trujillo, Research Director
rebecca.bromleytrujillo@cnu.edu
Office: (757) 594-9140
Mobile: (269) 598-5008
Threads: @profbromley-trujillo
Cami Castleberry, Director
cami.castleberry@cnu.edu
Office: (757) 594-8033
Mobile: (757) 897-4966